| ESBR | Employment | Income | International | Money | Output | Prices | Production | Transportation | SSBR |
|---|
| ESBR | Employment | Income | International | Money | Output | Prices | Production | Transportation | SSBR |
|---|
 CHART: New housing starts |
Housing Starts Privately owned housing starts in June were at a seasonally adjusted annual rate of 1,554,000, down 3% from the revised May figure of 1,596,000. |
Previous -3 May % change |
Current -3 June % change |
|
Provided by
U.S. Census Bureau as of July 20, 2000. |
|||
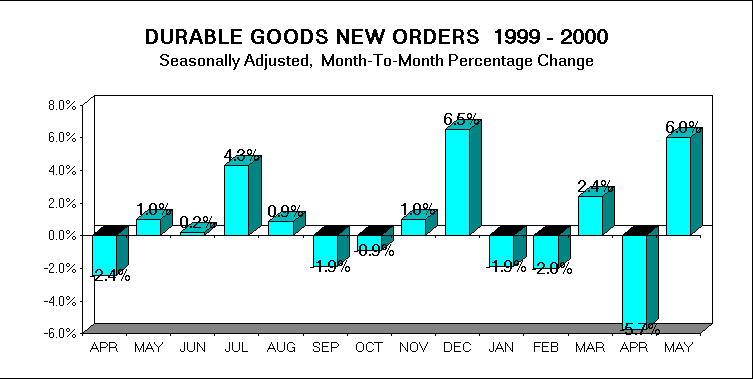 CHART: Durable goods new orders |
Advance Report on Durable Goods Manufacturers' Shipments and Orders New orders for manufactured durable goods in May increased $12.3 billion or 6.0 percent to $218.9 billion. (Released June 28, 2000) |
Previous -5.7 April 2000 % change |
Current +6.0 May 2000 % change |
|
Provided by
U.S. Census Bureau as of June 28, 2000. |
|||
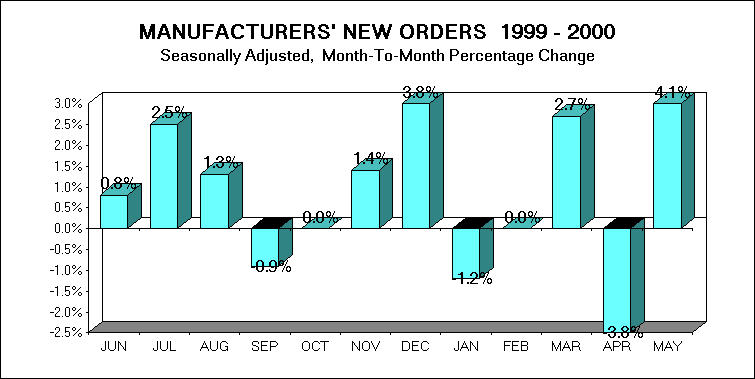 CHART: Manufacturers' new orders |
Manufacturers' Shipments, Inventories, and Orders New orders for manufactured goods in May increased $15.3 billion or 4.1 percent to $385.8 billion. (Released July 6, 2000) |
Previous -3.8 April 2000 % change |
Current +4.1 May 2000 % change |
|
Provided by
U.S. Census Bureau as of July 06, 2000. |
|||
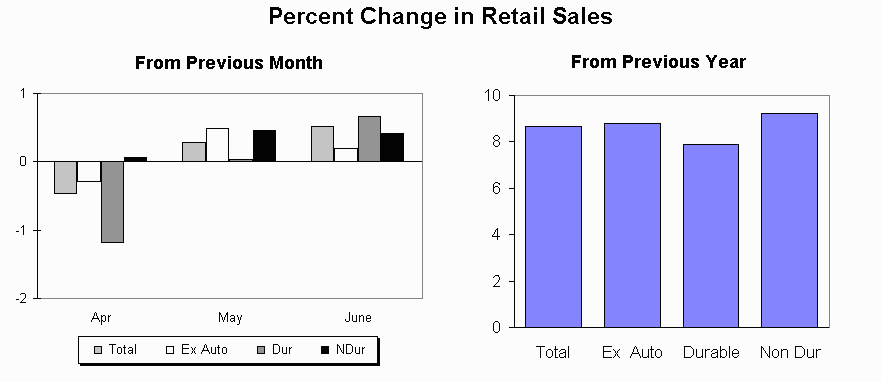 CHART: Monthly retail sales |
Advanced Retail Sales U.S. retail sales for June reached $269.3 billion, up 0.5% from the previous month. (Released 07/14/00) |
Previous +0.3 May 2000 % change |
Current +0.5 June 2000 % change |
|
Provided by
U.S. Census Bureau as of July 14, 2000. |
|||
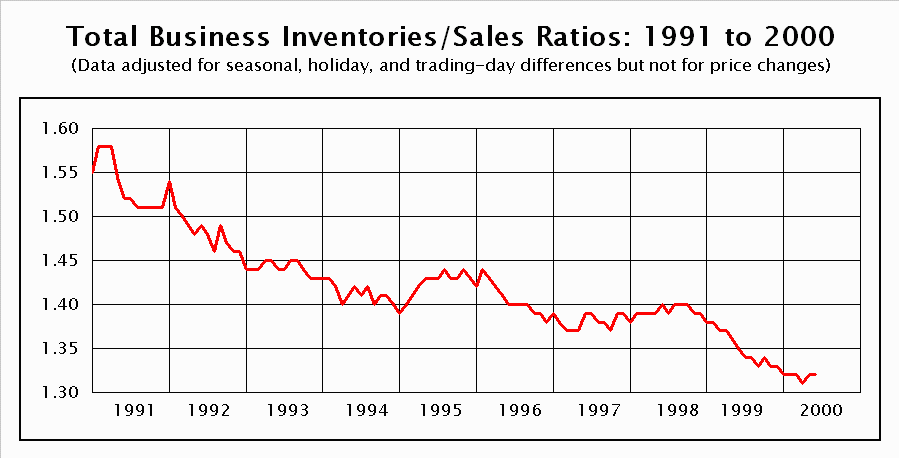 CHART: Total Business Sales |
Manufacturing and Trade Inventories and Sales U.S. total business sales for May were $895.4 bil, up 1.0% from last month. Month-end inventories were $1,180.9 bil, up 0.8% from last month. (Released 07/17/00) |
Previous -0.6 April 2000 % Change in sales |
Current 1.0 May 2000 % Change in sales |
|
Provided by
U.S. Census Bureau as of July 17, 2000. |
|||
 SUMMARY: G.17 Release |
Industrial Production Industrial production rose 0.2 percent in June, after gains of 0.5 percent in May and 0.8 percent in April. |
Previous .5 May 2000 (% change) |
Current +.2 Jun. 2000 (% change) |
|
Provided by
Federal Reserve Board as of July 14, 2000. |
|||
 SUMMARY: G.17 Release |
Capacity Utilization The rate of capacity utilization for total industry edged down in June to 82.1 percent, a level about even with the 1967-99 average. |
Previous 82.2 May 2000 (% of capacity) |
Current 82.1 Jun. 2000 (% of capacity) |
|
Provided by
Federal Reserve Board as of July 14, 2000. |
|||
| ESBR | Employment | Income | International | Money | Output | Prices | Production | Transportation | SSBR |
|---|
To comment on this service, send mail to feedback@www.whitehouse.gov.