| ESBR | Employment | Income | International | Money | Output | Prices | Production | Transportation | SSBR |
|---|
| ESBR | Employment | Income | International | Money | Output | Prices | Production | Transportation | SSBR |
|---|
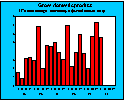 CHART: Gross Domestic Product, '95 - '00 |
Gross Domestic Product In 1st Qtr 2000, real GDP increased 5.5 percent at a seasonally adjusted annual rate. |
Previous +7.3 4th Qtr 1999 (% change) |
Current +5.5 1st Qtr 2000 (% change) |
|
Provided by
Bureau of Economic Analysis as of June 29, 2000. |
|||
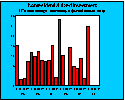 CHART: Nonresidential Fixed Investment, '95 - '00 |
Nonresidential Fixed Investment In 1st Qtr 2000, real nonresidential fixed investment increased 23.7 percent at a seasonally adjusted annual rate. |
Previous +2.9 4th Qtr 1999 (% change) |
Current +23.7 1st Qtr 2000 (% change) |
|
Provided by
Bureau of Economic Analysis as of June 29, 2000. |
|||
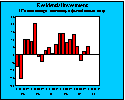 CHART: Gross Domestic Product, '95 - '00 |
Residential Investment In 1st Qtr 2000, real residential investment increased 5.2 percent at a seasonally adjusted annual rate. |
Previous +1.8 4th Qtr 1999 (% change) |
Current +5.2 1st Qtr 2000 (% change) |
|
Provided by
Bureau of Economic Analysis as of June 29, 2000. |
|||
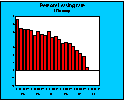 CHART: Personal Saving Rate, '95 - '00 |
Personal Saving Rate In 1st Qtr 2000, personal saving as a percentage of disposable personal income decreased to 0.3 percent. |
Previous +1.8 4th Qtr 1999 (% of disposable personal income) |
Current +0.3 1st Qtr 2000 (% of disposable personal income) |
|
Provided by
Bureau of Economic Analysis as of June 29, 2000. |
|||
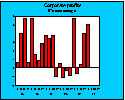 CHART: Corporate Profits, '95 - '00 |
Corporate Profits In 1st Qtr 2000 profits from current production increased 5.0 percent at a seasonally adjusted quarterly rate. |
Previous +4.0 4th Qtr 1999 (% change) |
Current +5.0 1st Qtr 2000 (% change) |
|
Provided by
Bureau of Economic Analysis as of June 29, 2000. |
|||
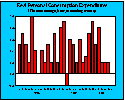 CHART: Personal Consumption Expenditures, '98-'00 |
Personal Consumption Expenditures In May 2000, real personal consumption expenditures increased 0.2 percent. |
Previous +0.2 April 2000 (% change) |
Current +0.2 May 2000 (% change) |
|
Provided by
Bureau of Economic Analysis as of June 30, 2000. |
|||
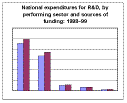 CHART: National R&D Funding |
Total U.S. Expenditures for Research and Development Preliminary estimates of R&D expenditures for 1999 indicate a 8.8% increase over 1998, or a 7.2% increase after adjusting for inflation. |
Previous $227.0 1998 (preliminary) (billions of dollars) |
Current $247.0 1999 (preliminary) (billions of dollars) |
|
Provided by
National Science Foundation/SRS as of December 15, 1999. |
|||
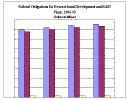 CHART: Federal R&D Obligations |
Federal Obligations for Research and Development and R&D Plant Federal obligations for research and development and R&D plant are expected to increase by an estimated 1.5 percent (to $75.3 billion) in fiscal year 1999. |
Previous $74.2 1998 (preliminary) (billions of dollars) |
Current $75.3 1999 (preliminary) (billions of dollars) |
|
Provided by
National Science Foundation/SRS as of January 6, 2000. |
|||
| ESBR | Employment | Income | International | Money | Output | Prices | Production | Transportation | SSBR |
|---|
To comment on this service, send mail to feedback@www.whitehouse.gov.